Therion: Export Centerline and LR (plan) from a LRUD Survey Data

razvid

New member
Hello all! I saw that many people here are using Therion, so maybe I can find an answer.

I have a survey with LRUD data, no splays.
It is possible to get from Therion the Centerline and the LR from each station in some format (XVI, PDF)?

I tried some solutions, but all I got is kind of image, the LR are doubled for each station... (i see that they are drawing as poligons for each segment).
Am I doing something wrong? Can I get only a pair of LR for each station?

Thank you in advance!

Razvan

1661195812066.png
 

alastairgott

Well-known member
Hi Razvid,

Great to see you on here, there is also the therion mailing list, the guys on there do not bite https://mailman.speleo.sk/listinfo/therion

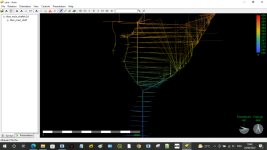
I have done something similar to what I think you're trying to achieve, we have a dataset for a large natural shaft in Derbyshire called Titan, Dave (moose) Nixon along with others produced a fine set of data up(/down?) the main shaft at regular intervals, which means we have cross sections of the shaft at each and every of these intervals.
titan.png

A fantastic resource, but how to get this into a format which would be useful to be able to draw around the cross sections, to create a likeness to the shaft in plan form?

I scratched my head quite a bit over this and came up with the following solution.

create a thconfig file like the below:
#source titan_main_shaft_90_91HG119_127.th
#export map -proj plan -fmt xvi -o "Main90_91TitanVolHG119_127.xvi"

#source titan_main_shaft_92_94HG116_118.th
#export map -proj plan -fmt xvi -o "Main92_94TitanVolHG116_118.xvi"

...etc...

source titan_main_shaft_141_144Bs200_202.th
export map -proj plan -fmt xvi -o "Main141_144TitanVolBs200_202.xvi"
-----

Each of the set of xvi's is generated from it's own corresponding data file, such as:
survey titan_main_shaft
centreline
data normal from to compass clino tape
extend right
calibrate compass 4.49

128 129 108.96 -61.75 4.669
129 130 51.34 -48.28 1.116
130 131 195.08 -43.46 1.303
131 132 0 -90 5
132 133 0 -90 5
133 134 0 -90 5
134 135 0 -90 5
135 136 0 -90 5
136 137 0 -90 5
137 138 0 -90 5
138 139 0 -90 5
139 140 0 -90 5
140 141 0 -90 5
141 142 0 -90 5
142 143 0 -90 3.6
142 144 241.17 -31.54 6.359

141 - 166.28 7.94 2.069
++50 other readings omitted from UKC thread for brevity!
142 - 74.23 -0.58 3.05
++37 other readings omitted from ukc for brevity!
endcentreline
endsurvey
-----

This should then produce an xvi which you can then use as a background image such as the example, then draw away, i wont teach you how to import background images as I can see you have that one covered.

titan plan cross section example.png
 

alastairgott

Well-known member
I did this with less faffing in the thconfig below:

source torcagales.th

#export map -proj plan -fmt xvi -o "torcagaleses8to11plan.xvi"
#export map -projection [elevation 90] -fmt xvi -o "torcagaleses.xvi"
-----

If you have any maps and inputs in your .th file, think of hashing these out. double hashed below for clarity.

survey torcagales -title "TCOV14<br>Torca de los Galesa<br><it>Valdelafuente, Andara,<br>Picos de Europa"

#TCOV14 - Torca de Los Galeses 0361844, 4790099 1223m

centreline

cs UTM30N
station 13 "TCOV14" entrance
fix 13 0361844 4790099 1223

date 2021.09.14
team "Alastair Gott"
team "Claire Vivian"
team "John Roe"
units length meters
units compass clino degrees
data normal from to length compass clino
extend right
0 1 1.90 268.8 23.7
# extend auto
0 . 4.06 295.3 29.8
0 . 5.14 265.1 29.6
0 . 6.05 243.3 25.0
0 . 3.55 240.2 26.8
0 . 1.98 195.0 14.6
0 . 3.11 179.7 -0.8
0 . 4.78 167.8 -9.2
0 . 3.29 150.0 -10.1
0 . 2.17 128.2 -8.3
0 . 2.02 84.4 -5.2
0 . 4.34 39.2 11.0
0 . 2.03 4.1 28.1
0 . 2.66 311.9 30.8
extend right
1 2 7.85 261.5 68.1
# extend auto
1 . 4.50 228.0 22.9
1 . 4.75 218.3 19.7
extend right
2 3 11.91 120.1 81.4
# extend auto
2 . 2.48 183.7 -19.4
2 . 3.70 173.8 -16.8
2 . 4.59 166.7 -13.1
2 . 3.99 154.4 -14.5
2 . 3.06 142.3 -15.5
extend right
3 4 7.17 268.8 78.1
# extend auto
3 . 7.15 269.6 78.0
3 . 5.17 184.1 -17.4
3 . 1.41 173.5 -14.8
3 . 4.14 179.9 -37.2
3 . 3.75 167.5 -37.4
extend right
4 5 15.41 140.6 84.7
5 6 2.84 302.6 80.4
# extend auto
5 . 2.01 177.4 -13.1
5 . 3.68 176.7 -12.9
5 . 2.57 173.7 -12.1
5 . 1.03 169.8 -11.4
5 . 0.54 74.6 -0.5
5 . 0.85 12.6 -10.1
5 . 4.74 6.9 -2.5
5 . 2.86 352.5 -2.0
5 . 2.19 340.7 -8.7
5 . 1.18 325.4 -6.9
5 . 0.62 269.8 1.3
extend right
6 7 10.15 349.0 84.4
# extend auto
6 . 4.27 177.5 68.1
6 . 1.59 144.4 69.3
6 . 1.22 326.8 68.3
6 . 1.98 353.2 33.6
6 . 5.33 357.2 25.9
6 . 5.90 13.2 23.6
6 . 7.00 24.0 19.6
6 . 6.51 25.6 19.4
6 . 2.92 32.4 9.9
6 . 2.52 12.9 8.6
6 . 2.78 356.5 6.9
extend right
7 8 5.22 84.4 73.0
8 9 6.12 151.5 87.8
# extend auto
8 . 6.23 214.3 82.0
extend right
9 10 6.34 213.5 81.8
# extend auto
9 . 6.44 213.2 81.9
9 . 1.76 238.9 -1.9
9 . 0.93 215.3 -3.2
9 . 1.22 237.0 -7.4
9 . 2.29 280.8 1.0
9 . 5.58 357.1 -7.5
9 . 1.87 14.9 -7.8
9 . 0.98 34.6 -5.6
9 . 3.82 319.7 -8.4
extend right
10 11 4.63 268.8 78.6
11 12 8.89 179.6 47.7
# extend auto
11 . 7.44 8.0 1.2
11 . 12.96 329.3 62.2
11 . 13.21 12.0 50.1
11 . 2.63 41.8 14.1
11 . 2.92 39.7 17.9
11 . 4.65 36.2 24.6
11 . 1.42 109.1 18.7
11 . 0.90 142.6 9.1
11 . 5.08 164.0 14.8
11 . 6.11 173.2 15.8
11 . 6.45 184.7 17.2
11 . 2.43 208.7 47.6
extend right
12 13 2.43 208.3 47.5
units left right up down meters
data dimensions station left right up down
8 0.00 0.77 0.77 0.00
1 3.06 0.00 0.00 0.00
6 0.24 3.79 3.79 0.00
5 2.89 4.25 4.25 0.82
0 4.63 3.24 3.24 0.76
11 2.53 3.04 3.04 0.00
9 0.02 3.63 3.63 0.73
3 4.91 0.02 0.02 2.50
2 0.00 3.36 3.36 1.07
endcenterline

##input "torcagales-1p.th2"
##input "torcagales-1s.th2"
##input "torcagalesesE90.th2"

##map m1p -projection plan
## torcagales-1p8-11
## break
## torcagales-1p6-7
## break
## torcagales-1p4-5
## break
## torcagales-1p
## endmap

## map m1s -projection extended
## torcagales-1s
## endmap

## map m1E90 -projection [elevation 90]
## torcagalesesE90sp1
## endmap


endsurvey
 

Steve Clark

Well-known member
If I understand your question correctly, you are already generating the correct thing with your plan xvi.

The shaded area you see is created from the LR dimensions. At each station, therion is drawing the LR as a shaded polygon perpendicular to the incoming survey leg AND perpendicular to the outgoing survey leg. This is normally the desired behaviour because it gives you maximum information should you want to draw walls over the top. In relatively straight passage the pair of points are close together. The 'correct' point is near the average of the two. When you are at a sharp bend in the passage, there is greater scope for the points to be further apart.

If you want to avoid the xvi process entirely and just output it directly to a pdf with shaded passage and a 1m grid on, you can use this example code in your layout. We use this to create very quick centreline sketches that we can draw over on the next trip/dive.

(This is in diving data format, but works the same with non-interleaved from-to data)


In data.th

survey examplecave -title "Example Cave"

centreline

# Survey on 1st Jan 2022

team "Steve Clark"
team "Jim Smith"

calibrate depth 0 -1

units compass deg
walls on

data diving station depth up down left right newline tape compass

STN01 0.0 0 0 0 0
12.0 080
STN02 2.1 1 1 2 1
12.0 095
STN03 7.0 1 1 2 1
3.4 080
STN04 5.4 1 1 3 1


endcentreline
endsurvey


In thconfig

source data.th

layout layout1
map-header 0 0 off
legend off
debug station-names
scale 1 100
grid top
grid-size 1 1 1 m
symbol-colour group cave-centreline [100 0 0 ]
color map-fg [90 90 90]
sketches off

code metapost
def s_hgrid (expr xpos, ypos, xsize, ysize) =
pickup PenD;
draw (
if xpos < 0: 0 else: -xsize/2 fi, 0
) -- (
if xpos > 0: 0 else: xsize/2 fi, 0
) withcolor (0, 0, 100);
draw (
0, if ypos < 0: 0 else: -ysize/2 fi
) -- (
0, if ypos > 0: 0 else: ysize/2 fi
) withcolor (0, 0, 1);
enddef;

endcode

endlayout

export map -layout layout1 -output plan.pdf
export map -layout layout1 -projection [elevation 0 deg] -output elev.pdf

Untitled2.jpg
 

Steve Clark

Well-known member
As an aside, we used a similar method as described by Alistair above to generate the cross section of an inaccessible 60m high aven above a deep lake beyond a sump. Stood at a single point on a silt bank, we shot dozens of disto shots and imported them all as from-to shots. Then generated an an xvi on plan and various elevation bearings to allow us to trace over.


The 3d profile exported to sketchfab, via autocad is here. The aven is about 1/4 of the way in. https://sketchfab.com/3d-models/st-georges-model-surface-v01-866c76164d644b2ba8b95f766d56155e


Untitled3.jpg
 
Top