
John_Smith
New member
Hello all,
Thought that I would get around to showing off my hard work from a while back.
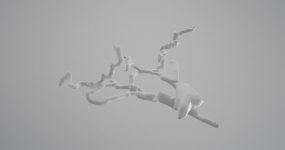
Here is a 3D model of Ariel Cave on Portland https://sketchfab.com/3d-models/ariel-cave-697f4d3389ed4985928de41ad9a16aee
I used QGIS 3.10 for the main GIS work (https://www.qgis.org/en/site/) and the Qgis2threejs Plugin for the 3D visualisation (https://qgis2threejs.readthedocs.io/en/docs/).
Essentially how I created this was using the following data:
1 LIDAR digital surface data (https://data.gov.uk/dataset/0ab507af-cd91-40cb-8524-3efafc267211/lidar-composite-dsm-50cm or https://data.gov.uk/dataset/80c522cc-e0bf-4466-8409-57a04c456197/lidar-composite-dsm-1m)
2 Ariel Cave survey (http://staticweb.mcra.org.uk/surveys/Ariel.pdf)
3 Google satellite imagery (XYZ tiles: http://www.google.cn/maps/vt?lyrs=s@189&gl=cn&x={x}&y={y}&z={z} or https://mt1.google.com/vt/lyrs=s&x={x}&y={y}&z={z})
And the following basic steps:
1 Georeference the Ariel Cave survey map
2 Digitise the passages and rifts
3 Using the survey, assign Z values for the passages and rifts based on altitude in metres
4 Load the data into Qgis2threejs and use the Z values from the LIDAR and digitised shapefiles to display height and drape the imagery over the LIDAR data
If more altitudes were available then tools like v.drape can be used within QGIS (https://grass.osgeo.org/grass76/manuals/v.drape.html), but this cave is essentially flat anyway...!
If anyone wants to know any more details, let me know and I can help you out with anything GIS related.
Enjoy!
Thought that I would get around to showing off my hard work from a while back.
Here is a 3D model of Ariel Cave on Portland https://sketchfab.com/3d-models/ariel-cave-697f4d3389ed4985928de41ad9a16aee
I used QGIS 3.10 for the main GIS work (https://www.qgis.org/en/site/) and the Qgis2threejs Plugin for the 3D visualisation (https://qgis2threejs.readthedocs.io/en/docs/).
Essentially how I created this was using the following data:
1 LIDAR digital surface data (https://data.gov.uk/dataset/0ab507af-cd91-40cb-8524-3efafc267211/lidar-composite-dsm-50cm or https://data.gov.uk/dataset/80c522cc-e0bf-4466-8409-57a04c456197/lidar-composite-dsm-1m)
2 Ariel Cave survey (http://staticweb.mcra.org.uk/surveys/Ariel.pdf)
3 Google satellite imagery (XYZ tiles: http://www.google.cn/maps/vt?lyrs=s@189&gl=cn&x={x}&y={y}&z={z} or https://mt1.google.com/vt/lyrs=s&x={x}&y={y}&z={z})
And the following basic steps:
1 Georeference the Ariel Cave survey map
2 Digitise the passages and rifts
3 Using the survey, assign Z values for the passages and rifts based on altitude in metres
4 Load the data into Qgis2threejs and use the Z values from the LIDAR and digitised shapefiles to display height and drape the imagery over the LIDAR data
If more altitudes were available then tools like v.drape can be used within QGIS (https://grass.osgeo.org/grass76/manuals/v.drape.html), but this cave is essentially flat anyway...!
If anyone wants to know any more details, let me know and I can help you out with anything GIS related.
Enjoy!