dave_the_cave
v brief answer : a lot of code.
brief answer:
From the bottom:
Most PC's/phones/tablets etc have 3d graphics processors of varying capability, This functionality usually exposed through 1 of 2 interface specs. (OpenGL & D3D (the microsoft proprietary version)).
Modern web browsers support 3d graphics through a spec 'WebGL 1.0', which supports a limited subset of OpenGL (so it can run on most phones on the market at the time the specification was defined). This allows Javascript programs to access high performance graphics, although with significant overhead compared with native applications.
https://www.khronos.org/webgl/
WebGL isn't a friendly spec to use, so various code libraries have been created to make things more user/programmer friendly. Three.js is one of the leading libraries. It provides functions to do all the matrix and vector maths required, and provides mechanisms to assemble scenes and send the information to the graphics processor, as well as 3d primitives like spheres, boxes etc.
https://threejs.org/ - lots of examples there which demonstrate the capabilities of three.js.
Incidentally Aven and Loch use similar C/C++ libraries to use OpenGL.
Iv'e written code to parse Survex .3d and Therion .lox files ( The .lox file isn't documented so I had to read the code, but it's a lot more straightforward than the .3d format), and transform the survey lines, LRUD walls and scraps for (.lox) files into lines and triangles required to create the scenes. Getting the basic lines visible is quite simple, making it efficient and fast and avoiding crashing the browser when using large surveys has taken a bit more work.
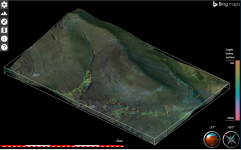
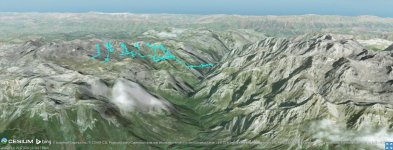
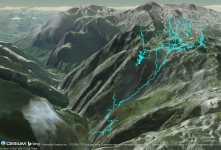
The Therion .lox files can contain terrains, Survex doesn't. To put terrains on .3d surveys, I have created terrain tiles from various public sources ( SRTM mapping, Ordnance Survey 1:50k mapping, Environment Agency high res lidar data (I use the GRASS GIS
https://grass.osgeo.org/ program to do this). By using the same tile sizes and locations as used by Bing/Google etc, I can then put various imagery over the terrain. This is only possible with Survex surveys that specify the coordinate system in use using *CS OUT directives. I use another library proj4js to handle transformation between coordinate systems ( OSGB36 -> WGS84 etc). Survex uses a related library proj4.
I'm looking at adding lines to indicate dye traces etc (obviously the real paths aren't known) - actually the code that does that is already there, it just needs a user interface, and improving tiling etc. I would like to add the BGS 1:50k mapping, but currently it is only available in a form that browsers won't pass to the 3d functions. Any features you would like to see? There is a lot of open data out there like SSSI boundaries, Scheduled Monuments etc that could be used to make custom imagery layers.
That's a brief summary, lots of detail missed out - mainly performance related. The chroma.js library was used to generate smooth colour gradients. This is my first 3d graphics program so there has been a lot of trial and error.